Instructions
Aim of the final assignment
The final project is a group work where the aim is to apply spatial data science methods to study a selected sustainability challenge, and report your findings in a poster. For the final project, you can select a pre-defined topic, or develop your own question. You should take advantage of your programming and spatial data science skills, version control skills (git + GitHub) and good coding practices (writing readable code) when doing the final assignment.
Instructions for the Final assignment (video)
Aalto University students can access the video by clicking the image below (requires login):

Start your assignment
Important
Note regarding the Final Assignment: This assignment is a group assignment, i.e. when you accept the Github Classroom below, it is possible for you to i) create a team OR ii) join to an existing team.
You should see something like this (click to open)
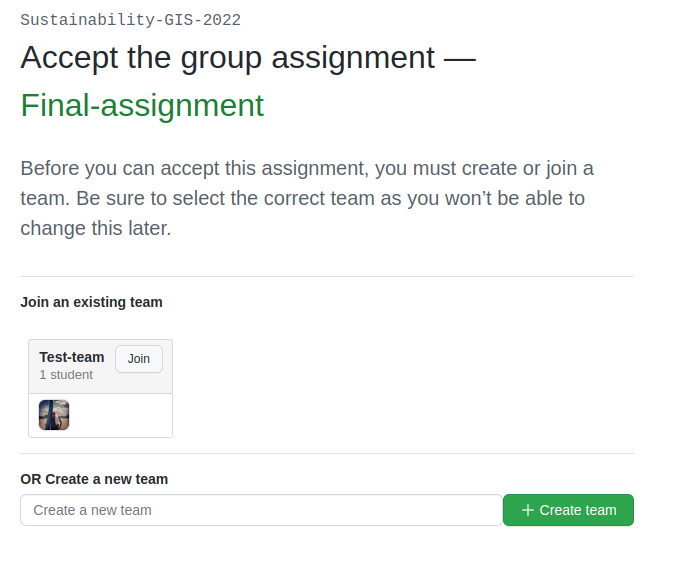
Before starting the final assignment, you need to communicate with your group members, who will create the team and give it an appropriate name, so that others can find and join the team. After this process, your team will have a shared repository for the final assignment and you can all access it with your Github accounts.
Start your assignment
Start your final assignment by:
accepting the GitHub Classroom for the final work.
After you have your personal exercise in GitHub, start doing the programming using CSC Notebook environment.
How to make a poster?
Return your poster as a Powerpoint presentation with a single slide or as a PDF with single page. In the poster session, you will be presenting your poster to the students.
How to work with the code?
The leading principle in terms of the programming parts of your final assignment is that the workflow should be repeatable and well documented. In other words, anyone who gets a copy of your repository should be able to run your code, and read your code. Document well the crucial parts of your code and especially remember to document the data sources that you use in your work and add links to the sources.
Organize all your material into your groups Final-Assignment repository and store your work into the final_assignment.ipynb file.
If you wish, you can write parts of your analysis workflow into separate Python script files (.py) and then apply them inside the Notebook.
Anyone who downloads the repository should be able to read your code and documentation and understand what is going on, and run your code in order to reproduce the same results.
Please return a clean and coherent notebook (think it as a supportive report/story with code alongside the poster) that only contains necessary code cells to reproduce and report the main findings of your analyses
Hence, you should remove all unnecessary code blocks for printing the first rows of the GeoDataFrame etc.
Please ensure that everything works before returning your work: Run the whole notebook (like this)
and return the work once you do not have any surprising errors and your results look as they should (this is what reproducibility is all about!).
Note: If your code requires some python packages not found in the csc notebooks environment, please mention them also in the report and provide installation instrutions.
Technical considerations
Document your analyses well using the Markdown cells and describe 1) what you are doing and 2) what you can see from the data and your results.
Use informative visualizations:
Create maps (static or interactive)
Create other kind of graphs (e.g. bar graphs, line graphs, scatter plots etc.)
Use subplots that allows to easily compare results side-by-side
When writing the codes, we highly recommend that you use and write functions for repetitive parts of the code. As a motivation: think that you should repeat your analyses for all cities in Finland, write your codes in a way that this would be possible. Furthermore, we recommend that you save those functions into a separate .py -script file that you import into the Notebook (see example from Geo-Python Lesson 4)
What should be returned?
As an output of this project, you should i) create a poster that documents your work and results (see separate instructions for the poster). In addition, your group should ii) return the codes that were used to create the results as a Jupyter Notebook (or alternatively as Python script files).
Poster: Return your poster as a Powerpoint presentation with a single slide or as a PDF with single page. In the poster session, you will be presenting your poster to the students. You can add the poster into your Github repository, or send it via email or Slack to Henrikki. Please send a message to Henrikki via Slack, once you are ready with the final work.
Codes: Return your codes (Notebook(s) etc.) via Github as instructed above.
Distribution of work: Because this is a group work, I want you to document and explain how did you distribute the work:
Who worked with the codes and analysis?
Who went through the literature (for background / contextual information)?
Who prepared the poster presentation?
When is the deadline?
The deadline for a FINALIZED POSTER is Tuesday February 22nd, 2022 when you should return your poster presentation to the teacher, as well as have the project codes (Notebook) available on the Github repository (edits can still be done). This is a hard deadline to get your poster, so that we have enough time to set up your poster to our poster-session.
The poster session is organized on Thursday 24th February at 09:15-12:00, when the groups present their poster on a virtual environment called Gather Town (link will be shared via Slack later).
The deadline for finalizing the Github repository (i.e. returning your codes + documentation ) is on Friday 25th February.
Grading
The grading is based on a typical 0-5 scale. The final assignment is graded based on:
Main analysis steps (data fetching, data analysis, visualization)
Repeatability (it should be possible to repeat the main analysis steps)
Quality of visualizations (maps and graphs)
Poster, presentation and overall documentation of the work
See more detailed grading criteria here
The grading is based on a typical 0-5 scale. The grade is based on a total of 50 points:
25 points for the poster and presentation based on following criteria:
is there a general description in about the research problem / purpose of the work?
is the usage of the methods described clearly?
are the results (maps, graphs) presented and explained clearly?
25 points for demonstrating major analysis steps/ functionality:
Finding relevant datasets
Reading and manipulating data
Analyzing data
Visualizations (maps, graphs)
Is the code written in a modular way (avoid repetition eg. using functions and for-loops)
Does everything work as it should
The “level of difficulty” in the analysis task is taken into account in the assessment (however, choose a challenge that you feel comfortable of doing)
Extra points available for other merits in the work:
something in the work is exceptionally well done
some problem in the code is solved in a “smart” way
the visualizations are exceptionally good
the written parts is thorough and relies on published research on the topic
Suggested topics
Option 1: Your own project work
For the final assignment, you can fully decide your own topic. Requirement for the work is that it needs to relate to sustainability and you need to apply spatial data science methods in your work. You can (for example) choose a specific SDG target and a subset of its indicators that you analyze and present in the poster. However, the topic can be something different as well (not directly related to SDGs).
Present your idea to the course instructor (at latest) by Friday 11.2 before starting it.
Option 2: Sustainable cities and communities
In this topic, the aim is to focus on Sustainable Development Goal 11 (Sustainable cities and communities) and create an analysis workflow in which you:
fetch the data for given area of interest (choose two areas so that you can compare them),
conduct the data analysis that aims to provide information related to the given target/indicator (i.e. what is the current state in the area based on the given indicator)
repeat the analysis workflow for another area of interest (e.g. in another city or neighborhood)
- report your findings with informative maps and graphics as well as in the poster
E.g. what does the indicators reveal?
How do the areas compare? Are there differences or similarities?
The main idea of the assignment is to calculate a set of metrics / indicators based on openly available data, and to compare the cities/regions based on these measures. This assignment is not accurately defined, as the idea is to allow you to use your own imagination and interest to explore different datasets and conduct analyses that interest to you, still providing useful insights about the given indicator in the areas that you picked.
NOTE: If many groups decide to work on SDG11 using the same set of indicators, we will plan/organize the work in such a way that every group will have a different set of cities that they are working on to avoid duplicate works.
Suggested indicators
If you have hard time choosing a target/indicator, we suggest that you focus on target 11.2, which is:
“By 2030, provide access to safe, affordable, accessible and sustainable transport systems for all, improving road safety, notably by expanding public transport, with special attention to the needs of those in vulnerable situations, women, children, persons with disabilities and older persons.”
As a starting point check the more detailed description for the indicator of this target provided by SDSN as well as the indicator metadata provided by UN. From the descriptions you can see that there are three proposed sub-indicators that constitute the indicator 11.2:
Access to all-weather road (% access within [x] km distance to road)
Percentage of people within 0.5km of public transit running at least every 20 minutes.
Your task is to find relevant information from open data sources (see Data section below, OpenStreetMap is a good place to start!) and construct metrics for these three sub-indicators for at least two different regions (cities) as described in the indicator documentation (above). In your poster, also reflect your thoughts about the suitability of the indicator to understand and measure the progress toward the target (do you see any issues, or have other comments?). Also reflect how well you were able to construct the indicators based on openly available data (are there any issues e.g. in terms of data quality?).
Notes
Notice that there are no specific criteria how you should conduct and do the analyses, as they are up to you to decide and figure out. As said earlier, the main purpose of the final assignment is to demonstrate your analysis and programming skills, so aim to do the work in a way that you feel comfortable with. Remember that getting things done is better than perfect!
As you might have experienced during this course, the programming parts can take time. Hence, it is recommended to distribute the workload in such a way that some member(s) of the group can start preparing the poster already early-on even before you have the results ready. It can take surprisingly long time to design a good poster with nice layout and visual appearance.
Useful documentation
Check these resources that are most likely very useful when doing the final assignment:
UN SDG indicators document provides an overview of all SDG goals and indicators to measure the progress.
Indicators and Monitoring Framework website provides more detailed explanation about the methodology, such as providing details how specific indicator should be calculated.
Metadata / methods description for all SDG indicators (downloads a Zip package with the descriptions ~154MB)
Data sources
You can use any (spatial) data that you can find, for example from the following sources:
OpenSreetMap (streets, buildings, points of interest, public transport stops, etc.) following the approaches learned during this course.
Data sources are not limited to these, hence you can also use other data from any source that you can find (remember to document where the data is coming from!).
Literature + inspiration
You can use the literature provided during the course as inspiration and as a source for information, but please remember to cite your sources appropriately in your final assignment. Add a reference list to the end of your notebook.